How to increase accuracy in field strength measurements
User corrections and how to apply them. Every wide band field strength sensor will have some frequency response over its frequency range. If uncorrected, this will lead to additional measurement deviations (errors). During accredited calibration of an isotropic field sensor the error is determined. This error will be given as frequency response correction factors for the individual X-, Y- and Z axis.
Most individual X,Y,Z-correction factors are included into the device driver of the EMC test software. These factors are applied to the probe as ‘multiply factor’. The EMC test software then multiplies each measurement value of the sensor with the correction factor at the current frequency. By performing this multiplication it determines the exact field strength level. This method however, has several risks that could lead to inaccurate measurements. First, most EMC software packages only use an average correction factor (average of X, Y and Z axis). However, every isotropic E-field sensor will have some imbalance between its measurement axis (X-Y and Z).
User corrections & Factors
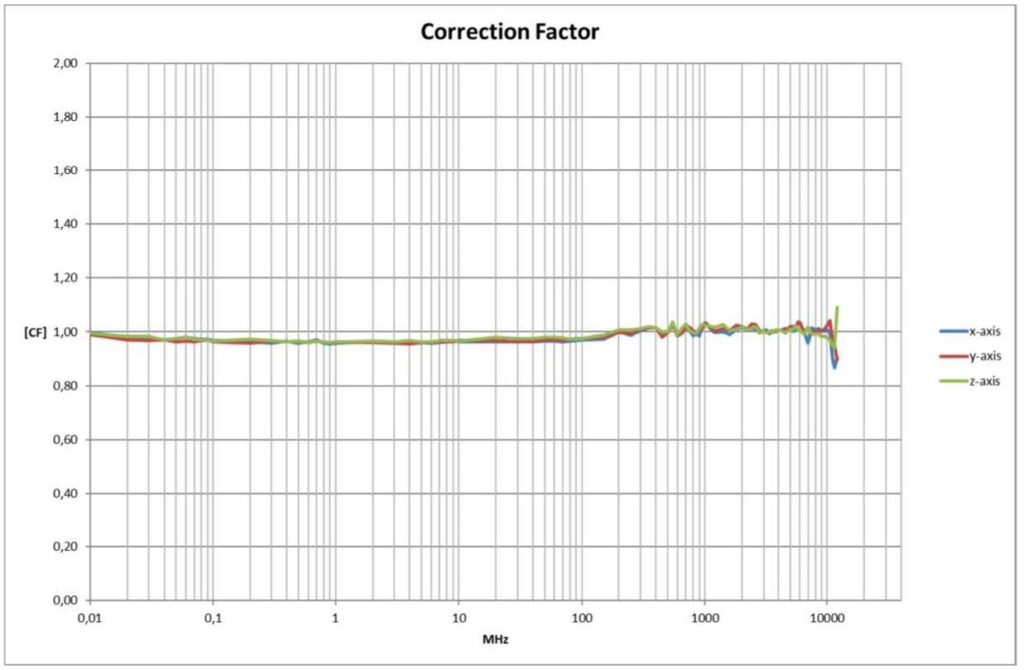
During the calibration of the field sensor, the frequency response of each axis is measured. This is accomplished by generating a known field strength with a known field orientation (horizontal or vertical). The field sensor is placed parallel into this field for each axis. This provides three different frequency response graphs as shown in figure 1. If the field sensor has a good isotropic performance and can work with applied field independent of the direction. There will hardly be any difference between the three frequency response graphs.
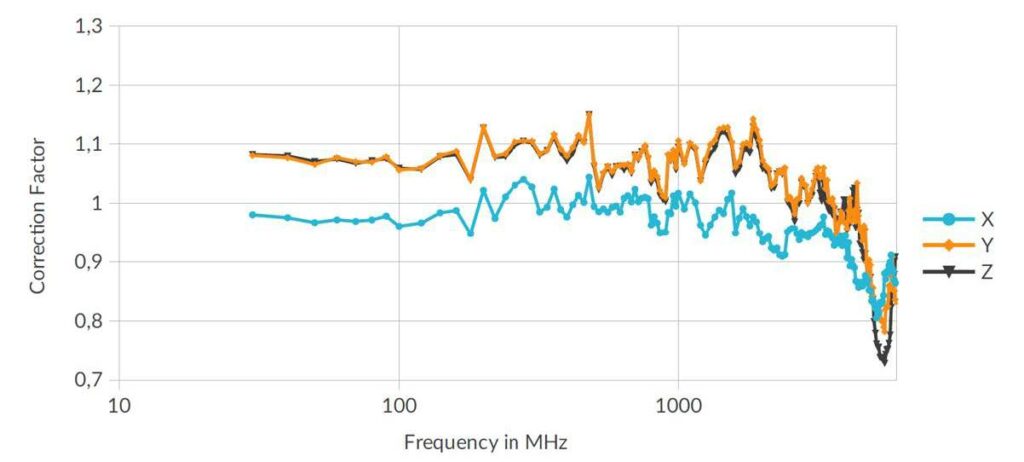
Field strength sensors with a poor isotropic performance and/or imbalance between the X-, Y- and Z-axis will show greater variation between the frequency response graphs of the three positions, like shown in the graph of figure 2.
These three-frequency response correction factor graphs can be used to calculate the ‘average’ isotropic frequency response correction. This correction file will now contain one, average, multiply factor for each calibration point over the entire frequency range of the field sensor. This correction factor file can now be included into the EMC test software to correct for the frequency response. See below figure 3 for an example of applying an average isotropic frequency correction file as multiply factor.
User corrections – mistakes happen!
One should be noted that calculating the average isotropic frequency response correction will be a ‘compromise’ method which will cause large measurement errors in case the field probe has a poor isotropic performance or imbalance between the axis. In a real-world situation in an anechoic chamber, where isotropic field strength sensors are used to measure the generated field at a known polarisation, reflections can cause errors in field uniformity that may vary up to +6 dB of the generated field strength level. These reflections can come from any angle causing ‘dips’ or holes’’ into the performance inside the anechoic chamber. A better, more accurate and easier way is to apply the X-, Y- and Z-axis isotropic frequency response graphs as individual multiply correction factors into the field sensor itself. In this way, errors caused due to:
Forgetting to apply correction factors,
Using wrong axis, correction factors,
Applying the corrections of another probe (different serial number),
Errors due to an average correction factor for the 3 axis, can be prevented.
User corrections inside your EMC probe!
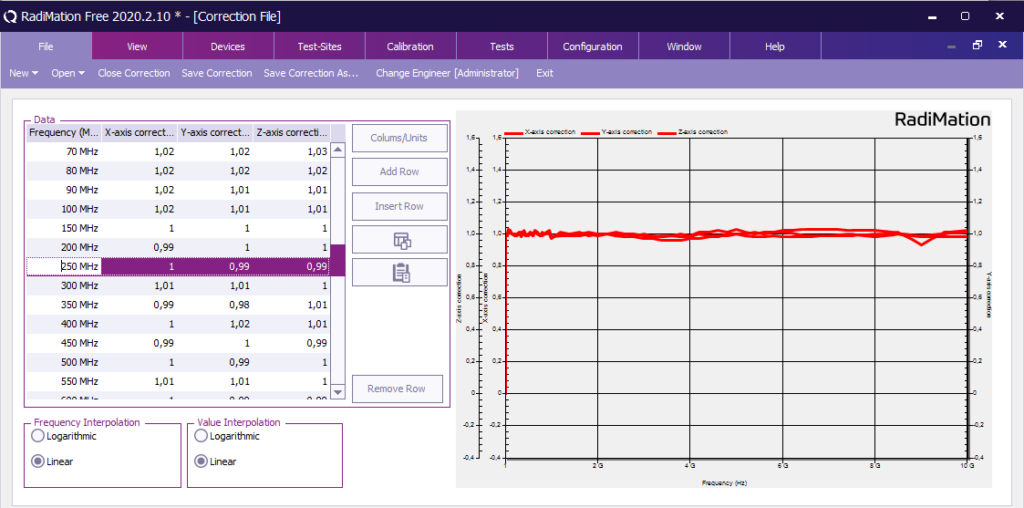
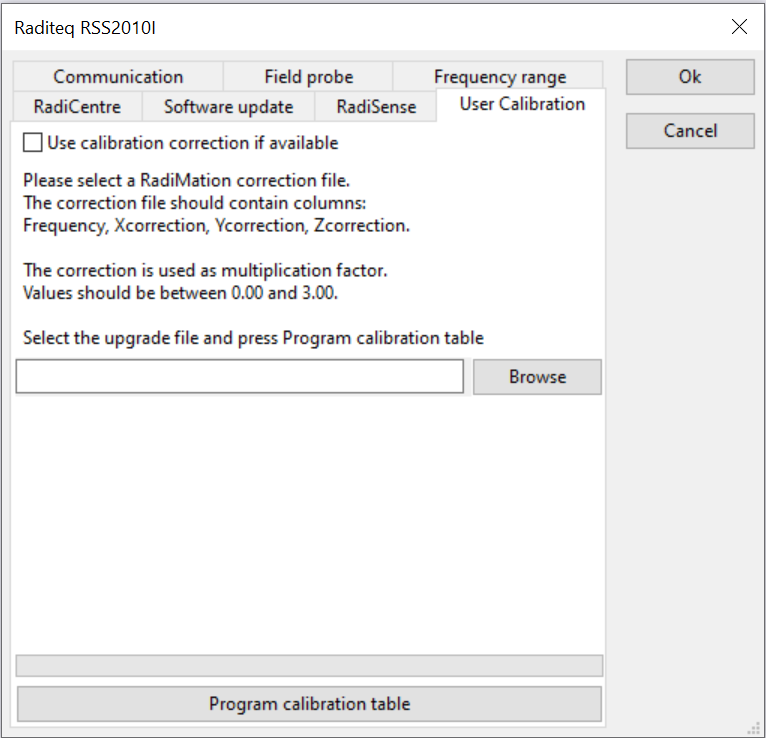
The RadiSense® 10 range of isotropic field strength sensors (*) can store the individual X-, Y- and Z frequency response graphs as ‘User correction’ inside the field sensor. This can be achieved in RadiMation® by creating a correction (COR) file based on the frequency Response calibration data of all three axis and store this file inside the field sensor as shown in figure 4.
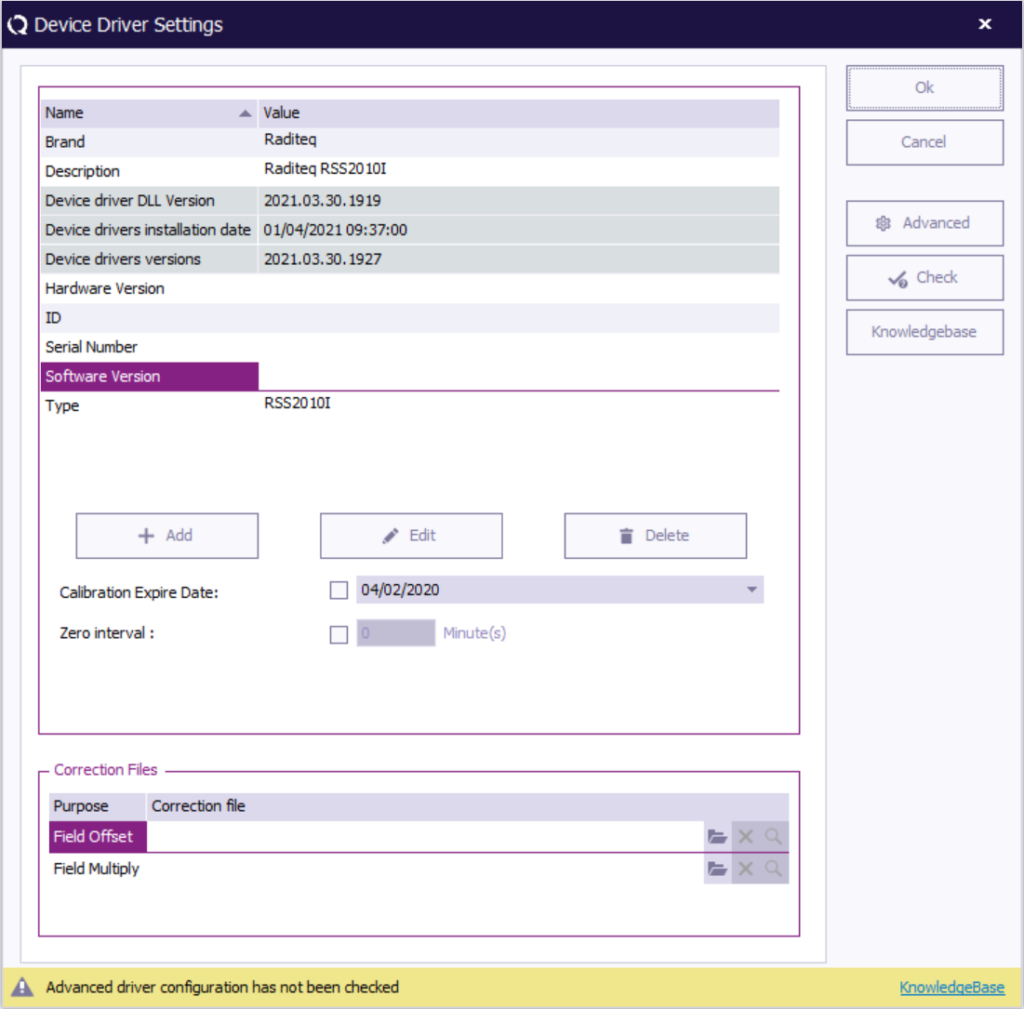
The ‘User corrections’ can be enabled or disabled by selecting or deselecting the ‘Check’ box in the RadiSense 10 device driver in RadiMation® as shown in figure 5.
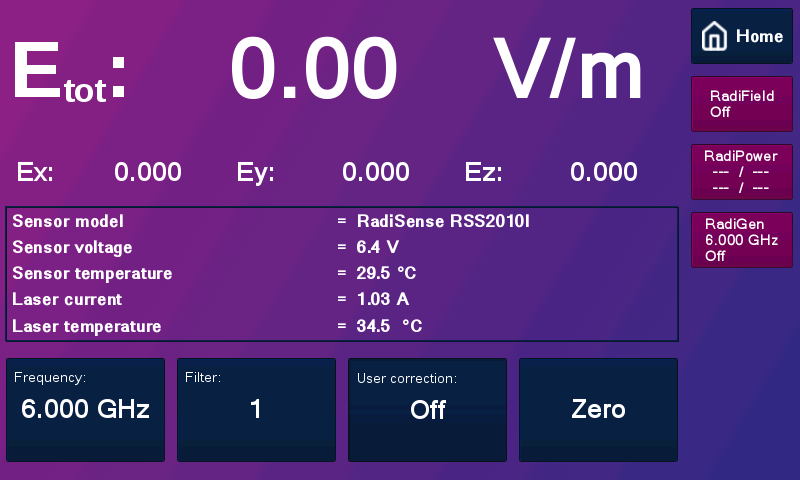
Alternatively, the corrections can be enabled or disabled by pressing the ‘User correction’ button on the touchscreen display of the RadiCentre® as shown in figure 6.
REMARK:
Make sure that the measurement frequency is being send to the RadiSense® 10 field sensor prior to a measurement. If the correct frequency is not set, this could cause inaccurate (wrong) measurements due to incorrect application of correction factors. The frequency set command is used by default in the RadiSense® 10 driver of RadiMation®.
When using the probe manually (through the RadiCentre®), the user must enter the correct frequency. This frequency setting need to be independent of whether the “user correction” is witched on or off. To determine if there are any “user corrections” stored inside the RadiSense® 10 field probe, by doing the following: the user can simply toggle the ‘User correction ON/OFF’ button on the touch-screen display of the RadiCentre® and check if the measured field level will change or not. If there is no change of reading, there are no “user corrections” stored inside the field probe. If there are “user corrections” stored, the value of the reading will change when toggling the ‘User correction ON/OFF’ button.
In case of doubt the correct “user correction” file can be re-stored into the probe. This can be achieved by overwriting any previously stored “user correction” data. This process can also be used when the RadiSense® 10 probe is being re-calibrated.